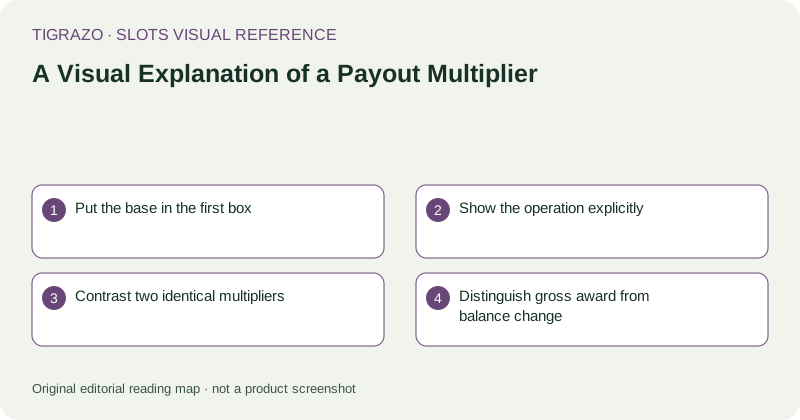
Put the base in the first box
Begin the schematic with a labelled base amount. This might be a line stake, total stake, individual symbol award or feature subtotal. The label is part of the mathematics. Without it, a large multiplier can appear to apply to whatever amount the reader happens to notice nearby.
Avoid starting with the multiplier in oversized type and adding the base later in tiny text. That layout emphasises the least informative number while hiding the one needed to interpret it.
Show the operation explicitly
Use a simple reading sequence: stated base, multiplication, resulting gross award. If the multiplier applies only after another calculation, include that earlier stage. Arrows should indicate the order of calculation, not an increase that is guaranteed to occur during play.
Hypothetical example: a qualifying award of 0.60 multiplied by 4 produces 2.40. Label 0.60 as the award before modification and 2.40 as the modified award. Neither number needs to be confused with the amount originally staked.
Contrast two identical multipliers
Hypothetical example: 10 times a 0.05 line stake equals 0.50. The same 10 times a 1.00 total stake equals 10.00. A side-by-side schematic makes the importance of the base immediately visible without suggesting that one example is more likely.
This comparison also explains why multiplier figures alone are insufficient for ranking games. Their bases, qualification rules and probabilities may differ. Identical typography does not establish identical financial meaning.
Distinguish gross award from balance change
If a round costs 1.00 and its final award is 2.40, the hypothetical net change is a gain of 1.40. Put the stake subtraction in a separate calculation rather than relabelling the gross award as profit. Some rule presentations have particular conventions about returned stakes, so establish the convention first.
For accumulated feature totals, check whether the multiplier applies to a new award or the entire stored amount. Applying it repeatedly to a cumulative total can inflate an example beyond what the rules permit.
Caption what the graphic cannot show
A calculation diagram explains an amount conditional on an event. It does not show the probability of that event unless a separate, supported probability model is supplied. More arrows, brighter colours or taller result boxes cannot supply that missing information.
- What exactly is being multiplied?
- Is the base stated in currency or credits?
- Is the result gross or net?
- Does the modifier affect one award or a subtotal?
- Is the example clearly hypothetical?
These labels turn a dramatic number into an interpretable relationship while leaving uncertainty about future outcomes intact.