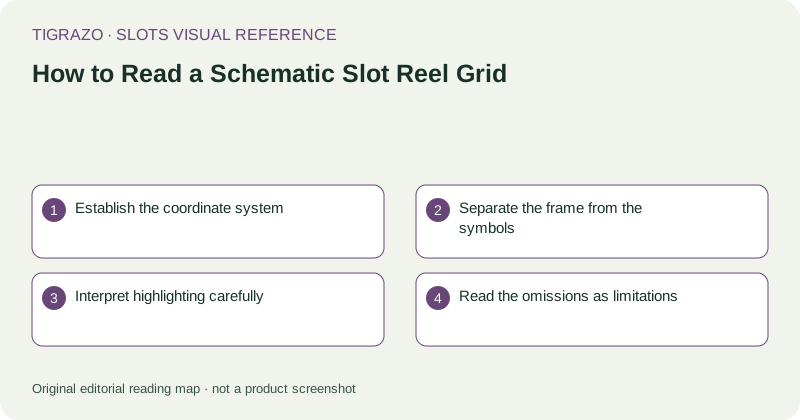
Establish the coordinate system
In a conventional schematic, columns represent reels and rows represent visible positions. Read the caption before assuming that convention applies. Some layouts have different reel heights, changing grids or positions that do not belong to a simple rectangle.
A useful editorial description identifies positions explicitly: reel two, top row, for example. This is more reliable than phrases such as the symbol over there. Coordinates let a reader follow the same example even when its visual styling changes.
Separate the frame from the symbols
The grid establishes where symbols can be shown. It does not, by itself, establish how awards qualify. A five-column, three-row frame could support paylines, ways or another rule system. The same arrangement of pictures can therefore have different meanings under different rules.
Read the frame as spatial information first. Then consult the symbol key and the stated award rule. This ordering prevents a familiar rectangular layout from silently importing rules from another game.
Interpret highlighting carefully
A coloured border may identify a selected position, a qualifying symbol, a substitution or a later replacement. These meanings need separate labels. A single bright colour used for all of them makes the diagram visually simple but conceptually ambiguous.
Hypothetical example: a diagram marks the middle positions on reels one, two and three. Under a specified left-to-right line rule, matching symbols there may illustrate a qualifying three-symbol award. The same marks alone do not establish whether reels four and five matter.
Read the omissions as limitations
A static grid normally omits reel strips, symbol weights, transition timing and the complete set of possible outcomes. Consequently, counting pictures in the illustration cannot establish symbol probability, RTP or hit frequency. The artist may have chosen symbols solely to make a rule legible.
Likewise, equal-sized cells do not imply equally likely symbols. A schematic communicates relationships, not a statistical model, unless it explicitly includes a documented model and explains how the diagram represents it.
Use a quick reading checklist
- Which dimension represents reels?
- Are row counts constant or variable?
- What does each highlight mean?
- Which award rule is being illustrated?
- Which mathematical information is absent?
A good caption might describe a hypothetical five-reel grid with one illustrated qualifying line. That wording identifies both the purpose and the limitation. It avoids presenting the image as a real screenshot or a typical outcome.
When the diagram and prose appear to disagree, stop at the mismatch. Do not resolve it by assuming the more visually persuasive element must be correct; an illustration can contain an editorial error just as text can.